|
|
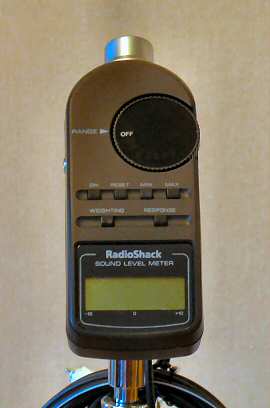
"SPL meters contain an omnidirectional microphone, so it doesn't matter which way the meter is pointed." |
By
Ethan Winer SPL meters are intended mainly to measure absolute sound volume levels, but they have other uses as well. Sound waves are rapid changes in air pressure, to which our ears respond. Therefore, SPL stands for Sound Pressure Level, though you'll sometimes see them called Sound Level Meters (SLM). In this article, we'll look at a number of practical applications for this seemingly simple device. I'll use the Radio Shack meter shown in Figure 1 for my examples because it's inexpensive and commonly available. Note that SPL meters are "reference" devices, so they must be calibrated at the factory using known absolute volume levels. The Radio Shack meter claims accuracy within 2 dB. You can also have an SPL meter calibrated by an independent lab, but that's usually reserved for the more expensive meters used by professional acousticians. In truth, SPL meters are quite simple - a built-in microphone and preamplifier are connected to a readout that displays the absolute sound level in decibels. Most SPL meters also have a Range control to accommodate a wide range of sound levels. For example, the Radio Shack meter can report levels between 50 and 126 decibels (dB), or a span of 76 dB. This might not seem large on the surface, but decibels are a logarithmic ratio, so the actual span is nearly 10,000 to 1! Top Used as originally intended to measure absolute volume levels, some common applications are:
An SPL meter is also useful for assessing relative levels, for example, to calibrate your 5.1 surround system to ensure that all speakers play at consistent volume levels. Calibration products, such as the Digital Video Essentials test DVD that I use, include signals that play through each speaker one at a time. This way you can adjust your receiver for identical levels from each speaker, and also adjust your subwoofer's volume relative to the other five speakers. You simply place the SPL meter where your head would be while listening, then play that section of the DVD. As each speaker sounds the test signal, you'll make a note of the level reported by the SPL meter. Then you can use your receiver's controls to adjust the volume for each speaker, so they're all the same. Unlike the directional microphones commonly used by singers and radio announcers, SPL meters contain an omnidirectional microphone, so in theory it doesn't matter which way the meter is pointed. But in practice, all omni microphones become somewhat directional at higher frequencies, so when balancing speakers the meter should point straight up. Top |
|
"If the SPL meter's microphone happens to be in a null location for 1 KHz, a nearby frequency, such as 1.1 KHz or 912 Hz, will not be in the same physical null."
|
THE
ANALOG VERSUS DIGITAL DEBATE No, not that debate! At various times, Radio Shack has offered two meter types - analog and digital - which refers only to the display. I prefer the digital version for one important reason: When used at the Slow setting to average sound levels that vary rapidly over time, it's a lot easier to read the digital display because it is steadier. Let's take a closer look. When using an SPL meter to calibrate loudspeaker levels, you can use either static sine waves or pink noise as the test signal. Sine wave test signals for level adjustment are usually 1 KHz, which is the center of the midrange. In this case the SPL meter will display a single number that corresponds to the volume received by its microphone. Because the tone's level is constant, there's no need to average readings over time. However, using sine waves is not a good choice for matching loudspeaker levels because they cause standing waves in the room. Standing waves create peaks and deep nulls in the frequency response that are highly positional. If you play a 1 KHz sine wave and note the level on the meter, then move the meter only a few inches, the level will likely be very different. Room acoustic treatment - especially absorption at the first reflection points - reduces the change in volume at different nearby locations but doesn't avoid it completely. Therefore, a much better signal source for matching loudspeaker levels is pink noise, which contains multiple frequencies. If the SPL meter's microphone happens to be in a null location for 1 KHz, a nearby frequency, such as 1.1 KHz or 912 Hz, will not be in the same physical null. Therefore, the big advantage of pink noise is its inherent averaging of volume level versus frequency. Taken as a whole, the measured volume will be fairly accurate. Top Pink noise contains all frequencies and sounds like tape hiss. Unlike white noise that contains equal energy at every frequency, pink noise contains equal energy per octave. Technically, pink noise is filtered to have less treble, falling off at a rate of 3 dB per octave. So with white noise, the range 100 to 200 Hz has the same energy as the range 10,000 to 10,100 Hz. With pink noise, the range 100 to 200 Hz has the same energy as the range from 10,000 to 20,000 Hz. Pink noise is less irritating to listen to than white noise, and you can also play a pink noise test signal much louder without risk of damage to your tweeters. The Digital Video Essentials DVD that I mentioned earlier takes this one step further and filters the pink noise to contain only midrange frequencies. The bass response in most domestic-size rooms varies wildly with position - much more than in the midrange - so filtering the noise ensures more consistent and reliable readings when used for matching loudspeaker levels. While pink noise is better overall for loudspeaker level matching than individual sine waves, there is one drawback: Because noise is by definition random, the volume constantly fluctuates both overall and at each frequency. So when viewed on a conventional signal meter, such as the VU meter in a cassette deck, the needle dances around making it difficult to read. The variance is typically several dB, though it can be 8 dB or even more at very low frequencies. So it might display 80 dB for a moment, then 77 dB, then 84 dB, and so forth. To get the true picture, you need to watch the meter carefully for ten seconds or even longer and mentally average all the numbers. And this is why I prefer the Radio Shack's digital SPL meter over the older analog model. The digital meter does a better job of averaging the variations over time. Top |
|
|
ROOM
ACOUSTIC MEASUREMENTS Most people have no idea how large an influence their listening rooms have on the overall frequency response of their systems. Numerous peak / null spans of 20 dB or even larger are not only common but typical, especially below 300 Hz. It astounds me that people will obsess over frequency response errors of less than 1 dB in electronic gear, yet totally ignore a room response such as the one shown in Figure 2 which, again, is absolutely typical. Note the peak/dip pair at 110 and 122 Hz where the response varies a staggering 32 dB across a range smaller than one musical whole step! There are two basic ways to measure the acoustic properties in a room. The simple method plays test signals at different frequencies, which you monitor on the SPL meter and draw as dots on semi-logarithmic graph paper. The most accurate way to measure the raw frequency response of your speakers and room is to use individual sine waves at 1 Hz increments for 300 Hz and below, and pink noise in third octave bands above 300 Hz. You can buy test tone CDs having sine waves at each of the 31 standard third octave frequencies, but they are not useful in my opinion. For example, the room response shown in Figure 2 has a peak at 110 Hz and a very deep null at 122 Hz. But the standard third octave test frequencies are 100 Hz and 125 Hz. So measuring only at 100 Hz and 125 Hz completely hides the real response! Top Further, as explained earlier, sine wave levels are highly positional at all frequencies, so such test CDs are not useful at mid and high frequencies either. Other commercial test CDs contain pink noise filtered into each standard third octave band. While that works fine at mid and high frequencies, third octave averaging lacks sufficient resolution at bass frequencies to see the true response. This is why I recommend sine waves at 1 Hz intervals for low frequencies, and third octave filtered pink noise above 300 Hz. You can download a collection of low frequency MP3 files to create your own bass-range test CD here: www.realtraps.com/test-cd.htm |
"Modal ringing is the main cause of the problem commonly known as 'one note bass,' where all bass notes sound more or less the same, regardless of their actual pitch."
|
MODAL
RING DECAY TIMES So far we've considered only the frequency response of loudspeakers and the room they're in, as measured with an SPL meter. However, assessing room acoustics properly also requires measuring in the time domain. Many people use their SPL meters mainly as microphones to feed a computer sound card and software for room measurements. Because the Radio Shack meter has a line-level output, it can be plugged directly into the line input of a sound card without needing a separate microphone preamp. There are a number of popular and affordable programs available for measuring room acoustics. The advantage of software, versus using simple test signals and an SPL meter, is being able to measure not only frequency response but also modal ringing, individual reflections, and reverb time. Small rooms don't really have true reverberation as you'll find in an auditorium or gymnasium, but the same metrics are often used. In small rooms the reflections create a series of individual echoes that decay fairly rapidly, versus true reverb that first swells over time and then decays. Top I use the ETF and R+D software for Windows that costs $150 for both from www.etfacoustic.com. For Mac users, I recommend FuzzMeasure, available for $150 from www.fuzzmeasure.com. There's also an excellent freeware program called Room EQ Wizard (REW) that runs on both Windows and Mac OS. Although REW is intended mainly for adjusting an equalizer to compensate for poor bass response (not recommended as explained below), it's a fairly full-featured room analysis program in its own right. Unlike the simple response graph shown earlier in Figure 2, room analysis programs can also display modal ringing using what's called a waterfall plot. Ringing is a big problem in all small rooms, and it causes some, but not all, bass notes to linger even after the bass player stops the note from sounding. This is similar to the "boing" sound you get when you clap your hands in an empty room or stairwell, but it happens at low frequencies that can't be tested with hand claps. Ringing is caused by room modes, which are resonances that occur at frequencies related to the room's dimensions. Figures 3a and 3b show a pair of ETF graphs that I measured in the RealTraps test lab when completely empty except for one loudspeaker, the measuring microphone, and computer. This room is about 16 by 11 by 8 feet high, and you can see that the response is just as terrible - though absolutely typical! - as the response graph from the other room shown earlier in Figure 2. Top As you can see, Figure 3b shows the same frequency response as Figure 3a, but it also shows the decay time of each mode frequency. In this type of graph, the "mountains" come forward over time. Modal ringing is the main cause of the problem commonly known as "one note bass," where all bass notes sound more or less the same, regardless of their actual pitch. With a waterfall graph, you can clearly see that each peak in the response is accompanied by ringing that decays slowly over time. Ringing is a huge problem because it causes some bass notes to sustain and overlap subsequent notes. This results in indistinct and muddy sounding bass because no matter which note is played, the room's ringing sounds at the same dominant frequency. And because the ringing tones also linger, there's more total energy in the room at those frequencies. Using simple test signals and an SPL meter measures only the frequency response and ignores the ringing. Likewise, using hand claps to test a room creates mostly midrange frequencies, so that won't reveal modal ringing problems either. Top |
|
|
MICROPHONE
ACCURACY It's worth mentioning that inexpensive SPL meters use inexpensive microphones that are not as accurate as professional microphones. Fortunately the Radio Shack's meter is fairly accurate at bass frequencies, though above 1 KHz its accuracy is much worse. I use a precision DPA 4090 microphone for room testing; but at about $700, it costs a lot more than the Radio Shack meter! However, even if the microphone in an inexpensive meter is not absolutely accurate, it is still useful to assess relative changes, for example, to see how the response and ringing in your room improve as bass traps and other treatment are added. Figures 4a and 4b show a comparison of my Radio Shack SPL meter and a precision calibrated AKG microphone, both at low and mid/high frequencies. As you can see, the Radio Shack meter's response is within 1 dB of the much more expensive microphone up to about 800 Hz, then deviates substantially at higher frequencies. You'll find "calibration" curves on the Internet that claim to compensate for the Radio Shack meter's inaccuracy, but these are mostly worthless if well-intentioned. As you can see in Figure 4a, the Radio Shack meter's response is fine at bass frequencies, so no correction is needed. But above 1 KHz it's unlikely that these meters are consistent from unit to unit, anyway, for various reasons. So there's no assurance that someone else's meter has the same frequency response as yours. Further, measuring a microphone's frequency response is not a trivial task - I can't imagine that most people who post correction curves are skilled enough or have the tools to do that correctly. Added September 16, 2008: Also see our Microphone Comparison article. Top NUTS AND BOLTS When used as a microphone front end for software room analysis, the only knob you need to adjust on a Radio Shack SPL meter is the range. You'll set your computer's software mixer for maximum input level, then use the Range switch to control the actual signal level going to the computer sound card. But for other applications it helps to understand what the various knobs and switches do. There's no need to duplicate the owner's manual here, so I'll mention these features briefly just for the benefit of those who do not (yet) own SPL meters. The Weighting switch selects one of two frequency response curves the meter uses to bias the display. Our ears hear midrange frequencies more readily than extreme bass or treble, so when the goal is to assess perceived volume - how loud something actually sounds - the A weighting curve is preferred. With A weighting, sound containing mainly midrange frequencies displays a higher value than very low or very high frequencies of the same physical SPL level. But when measuring the frequency response of a loudspeaker or room, you'll use C weighting because in that case you want the true response. Note that the Radio Shack meter always powers up with C weighting engaged. The Response button selects Fast or Slow meter response times. For most uses, it doesn't really matter which speed you select because the speed affects only the bar-graph portion of the display. The actual numbers never change so quickly that you can't read them. The default for response speed is Fast. The Radio Shack SPL meter also has buttons that let you tell it to remember the loudest, softest, and average levels it measures over time. This way you can leave the meter unattended for a while, then come back later to see what happened. Top |
|
"The only place an equalizer makes sense is at the very lowest octave below, say, 40 or 50 Hz, where conventional bass traps tend to be less effective." |
USING
EQ TO CORRECT ROOM ACOUSTIC PROBLEMS IS FUTILE Because so many people use SPL meters for measuring room acoustics, I'll conclude by explaining why you should not try to equalize a system for a flat frequency response. It may seem that an equalizer could be used to reduce peaks and raise nulls to obtain a flat response from your loudspeakers and room. But in practice it simply does not work, and in most cases using EQ results in a worse sound, not better. One big problem is that peaks and nulls are highly positional. So any correction that you apply will be valid only for a very small physical area. Indeed, in most rooms it's not even possible to get the response flat for both ears at the same time! Moreover, modal ringing as mentioned earlier is at least as damaging as the peaks and nulls, and EQ cannot improve that. Nor can EQ counter the typical nulls that are 10 to 30 dB deep without blowing up your amp and speakers. Newer systems claim that their use of sophisticated DSP (Digital Signal Processing) overcomes the problems with equalizers, but they suffer from the same problems for the same reasons. The more correction that is applied, the smaller the improved physical area becomes. So using either EQ or a DSP system is guaranteed to make the response worse elsewhere in the room, even the next seat over on a couch. The only place an equalizer makes sense is at the very lowest octave below, say, 40 or 50 Hz, where conventional bass traps tend to be less effective. Even then, an equalizer should be used to reduce peaks only - never to try to bring up a null. Top
Ethan Winer has been a professional musician, composer, circuit designer, recording engineer, audio instructor, computer programmer, technical writer, and consultant since the 1960s. He was a contributing editor for PC Magazine for many years and has written more than 70 feature articles. Ethan now designs acoustic treatment products and runs RealTraps, in New Milford, CT. |
|
Entire contents
of this site Copyright © 2004- by RealTraps, LLC. All rights reserved. |
)
)
)
)
)
